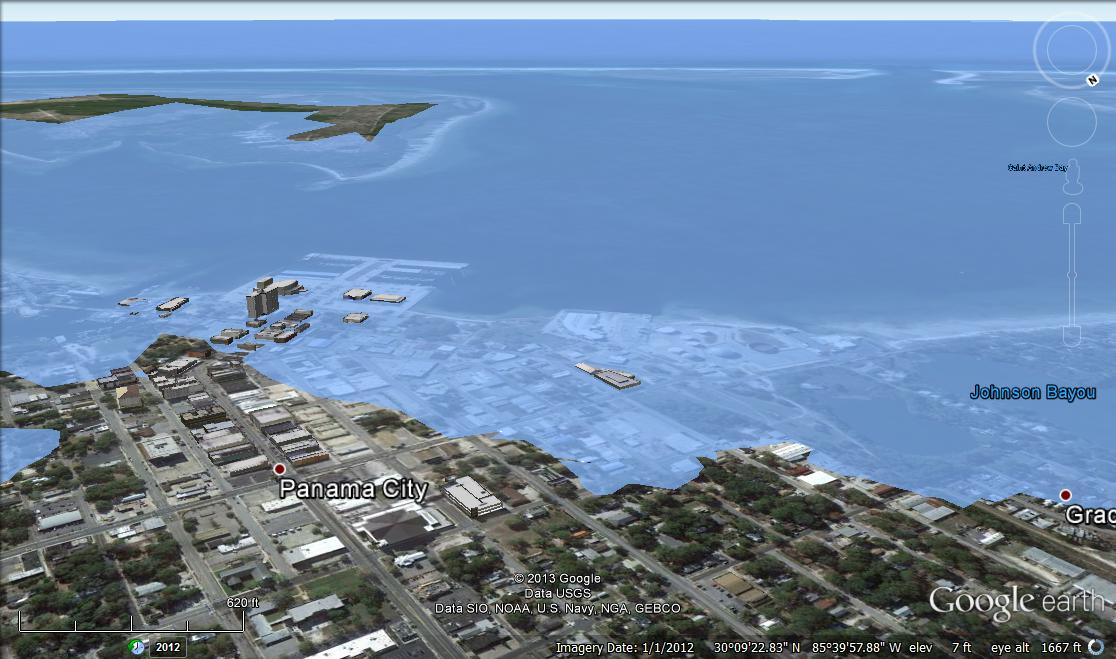
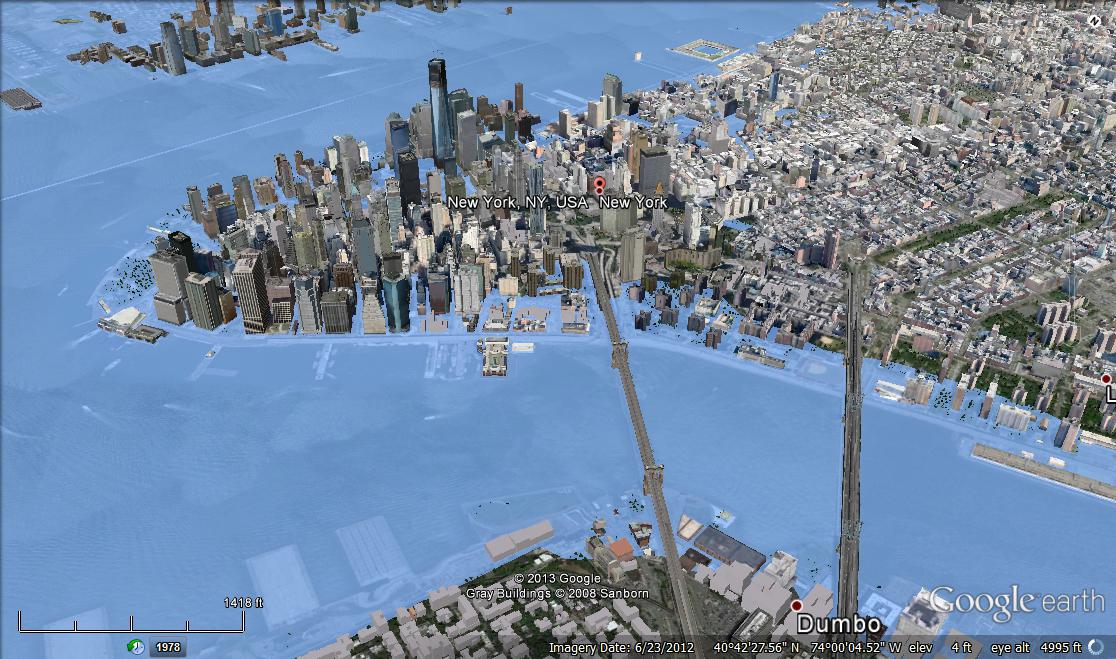
Last week, I kicked off the #DrownYourTown Coastal States Road Trip with a cruise through California. Over the next few weeks, we’ll visit every coastal US state (and territory) and see what they look like after 5 meters of sea level rise. The first week of images is available at the #DrownYourTown tumblr and you can follow along in real time on twitter @DrownYourTown.

Why did I pick 5 meters of sea level rise rather than the predicted 1.4 that we’ll see by 2100? One of the biggest problem with #DrownYourTown is that altitude on Google Earth is calculated from mean sea level. This means that, in many places where the tide can fluctuate by more than a meter, an extra meter barely registers. There are places in Alaska with 10 meter tides. Rather than try to capture that extreme diversity, I chose 5 meters to better capture the combination of sea level rise and high tide that some areas might expect to see.

As always, with #DrownYourTown, these images are not precise representations of sea level rise, but rather visualizations of the potential effects of climate change.