We have a new paper out today in the journal Aquatic Ecology! Read it here, open access copy here. This is the last paper from my Ph.D. dissertation, and coauthors include my Ph.D. advisor Dr. Neil Hammerschlag, Ph.D. committee member Dr. Mike Heithaus, and colleague Dr. Les Kaufman. It’s called “Intraspecific Differences in Relative Isotopic Niche Area and Overlap of Co-occurring Sharks,” which I think rolls right off the tongue and would make a pretty sweet band name. This research was crowdfunded by the SciFund challenge a few years ago, so thanks again for your support! I want to tell you a little bit about what we did and what we found!

A quick primer on stable isotope analysis
The research method we used, stable isotope analysis is a non-lethal, minimally invasive way to study patterns of resource use in animals. It’s based on the principle that at the molecular level, you really are what you eat! If I ate nothing but steak and you eat nothing but kale, those disparate diets would be reflected in isotopic signatures in our body tissues that we can measure scientifically. For more complex diets this gets complicated very quickly, but the general principle is the same! If you’d like to learn more about stable isotope analysis, check out this introductory review I wrote for the journal Marine and Freshwater Research or this paper about my Masters research on stable isotope feeding ecology of sandbar sharks #BestShark!
Basically, instead of cutting a shark in half to see what’s in its stomach*, all we have do is take a very small tissue sample from the shark (in this study, we used blood. Relative ratios of stable isotopes of Carbon and Nitrogen in animal tissues change in a predictable, stepwise pattern with every trophic level (or step in the food web). By comparing the stable isotope values of predators vs. prey in a food web, you can infer what a consumer is eating or not eating. Or, as in the case of our paper here, by comparing the stable isotope values of lots of different predators, you can infer whether or not two predator species are likely competing for the same prey resources. (*Yes Chuck I know that some people make sharks vomit into a bucket instead of cutting their stomachs open but this is less common than the method I describe.)
Before I get into our results, I want to show you how to interpret some sample data. The pluses below are the mean plus or minus one standard error for data from two different species. The y axis is a measure of the relative ratios of nitrogen isotopes (and higher means feeding higher in the food chain), and the x axis is a measure of the relative ratios of carbon isotopes. Different X values as soon here mean that that two species are likely feeding in distinct food chains supported by different carbon sources; for example, one is feeding on a seagrass-based food chain and the other is feeding on an algae-growing-on-rocks based food chain.

In addition to presenting the mean plus or minus one standard error, we generated ellipses for each species using a program called SIBER (pronounced See Brrrrr). These ellipses represent more of the total isotopic niche space used by a species than just a mean, which means you can measure different aspects of an animal’s resource use with them. The B in SIBER stands for Bayesian, so the math gets complicated real fast here, but what I’m mostly interested in is overlap between ellipses of different species.
If the ellipses of two different species do not overlap at all, it strongly suggests that those two species eat totally different things and therefore don’t compete for prey resources (picture going to an all-you-can-eat buffet with a friend who only hits the salad bar while you go straight for pasta station, neither of you would have to wait for the other or have to fight the other for scraps, you’d both have plenty of food). If the ellipses of two different species overlap a lot, it might, but does not necessarily, mean that those two species share diets, which would mean that they compete for prey resources (picture a long line at the rapidly-diminishing chocolate fondue station at the buffet). Again, the math here gets complicated real quick, but the presence non-overlapping ellipses is very strong evidence of non-overlapping diets (“resource partitioning,”) while overlapping ellipses are evidence (but not as strong) of overlapping diets (competition for prey).

So here’s what we did
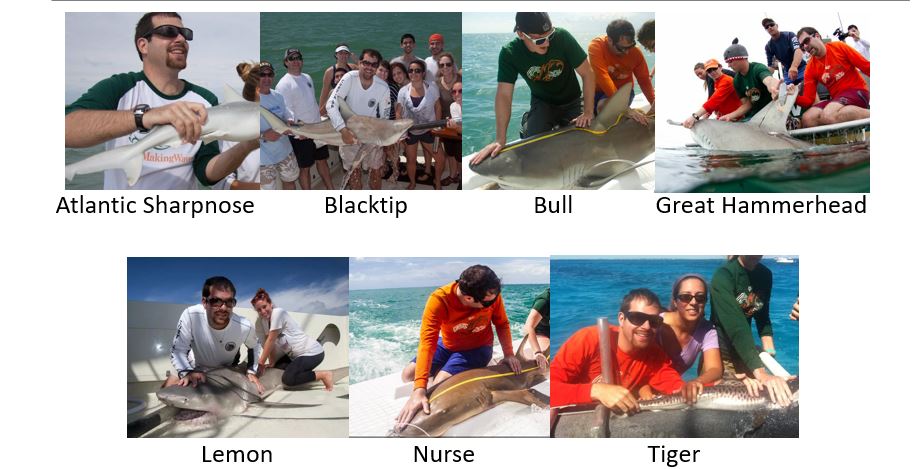
We collected tissues for stable isotope analysis from 299 sharks of 11 species in three study areas in South Florida: Biscayne Bay, Florida Bay (mostly the Everglades National Park), and a coral reef in the Keys.

The important point here is that we did this in three different study areas, which differ in depth, bottom type, and what prey species are available. We wanted to see if relationships between the same pairs of co-occurring shark species were the same in every, something that has rarely been studied before. Spoiler: they’re not, because nothing about studying sharks is easy!
Here’s what we found
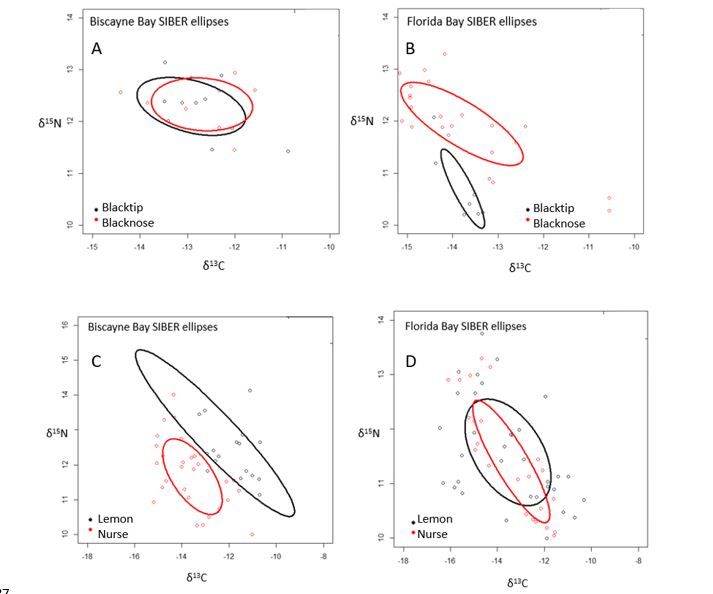
Panels A and B here are ellipses blacktip (black) and blacknose (red) sharks in Biscayne Bay and Florida Bay. You’ll notice in Biscayne Bay the ellipses overlap almost completely… but in Florida Bay they don’t overlap at all! Panels C and D show a similar pattern for lemon (black) and nurse (red) sharks. In Biscayne Bay, the ellipses of these species don’t overlap at all, but in Florida Bay they overlap almost completely!

These weren’t the only relationships between co-occurring shark species that changed completely from one study area to the next. Bull sharks had the biggest ellipses of any species (suggesting that they have the most diverse diet) at Florida Bay and the Reef, but an intermediate ellipse area relative to other species at Biscayne Bay! Check out the paper for more examples of flip-flopping like this.
What does it all mean?
All of this gets extra weird when you realize that these three study areas are so close to one another that most of these sharks could swim between them in less than a day! So going back to our all-you-can-eat buffet analogy, this means that at Golden Corral for lunch, you eat only pasta while your friend only eats salad, but when you two go to Ye Olde Country Buffet a few miles down the highway for dinner, you fight over who gets the last few pieces of fried chicken. The same people (or species) behave totally differently when deciding what to eat, and whether or not fighting with the other person (or species) for food is the best decision.
Feeding ecology is complicated, and though we often generalize it (e.g., “tiger sharks eat sea turtles,”) the details are tricky. When you’re talking about something like food web modeling for ecosystem-based fisheries management, these details matter. Lots of times when scientists and managers don’t have the exact data we need, we substitute the best available data, such as a similar study with the same species of interest from somewhere nearby. The results of this study show that if you wanted to know if blacktip and blacknose sharks compete for prey or partition resources in Florida Bay, and you tried to substitute data from these same species from a habitat just up the coast, you’d get exactly the opposite results!
Quotes for journalists interested in covering this work
We are available for interview about this work. Please e-mail me WhySharksMatter at gmail with subject line MEDIA REQUEST: stable isotope analysis paper
From lead author Dr. David Shiffman, a Liber Ero Postdoctoral Research Fellow in Conservation Biology at Simon Fraser University
On a molecular level, you really are what you eat, and scientists can track animals’ diets and patterns of resource use using this principle and a method called stable isotope analysis. Our analysis shows that when two shark species are found in the same habitat, sometimes they decide to go for different prey entirely and avoid competition, but sometimes they go for the same prey and compete with one another- even when it’s the same two species in two nearby habitats! These results gave me a new appreciation for how complicated the feeding behaviors of sharks really are- they can totally shift their strategies for obtaining resources even when we’re talking about the same two species in habitats a few miles away!
From senior author Dr. Neil Hammerschlag, research assistant professor, University of Miami.
Our results suggest the ways shark species exploit resources, such as food and space, in one location may differ in a neighboring location, despite both areas being relatively similar biologically. Understanding how sharks interact with each-other as well as other species in the environment is challenging, but important from an ecological and conservation perspective