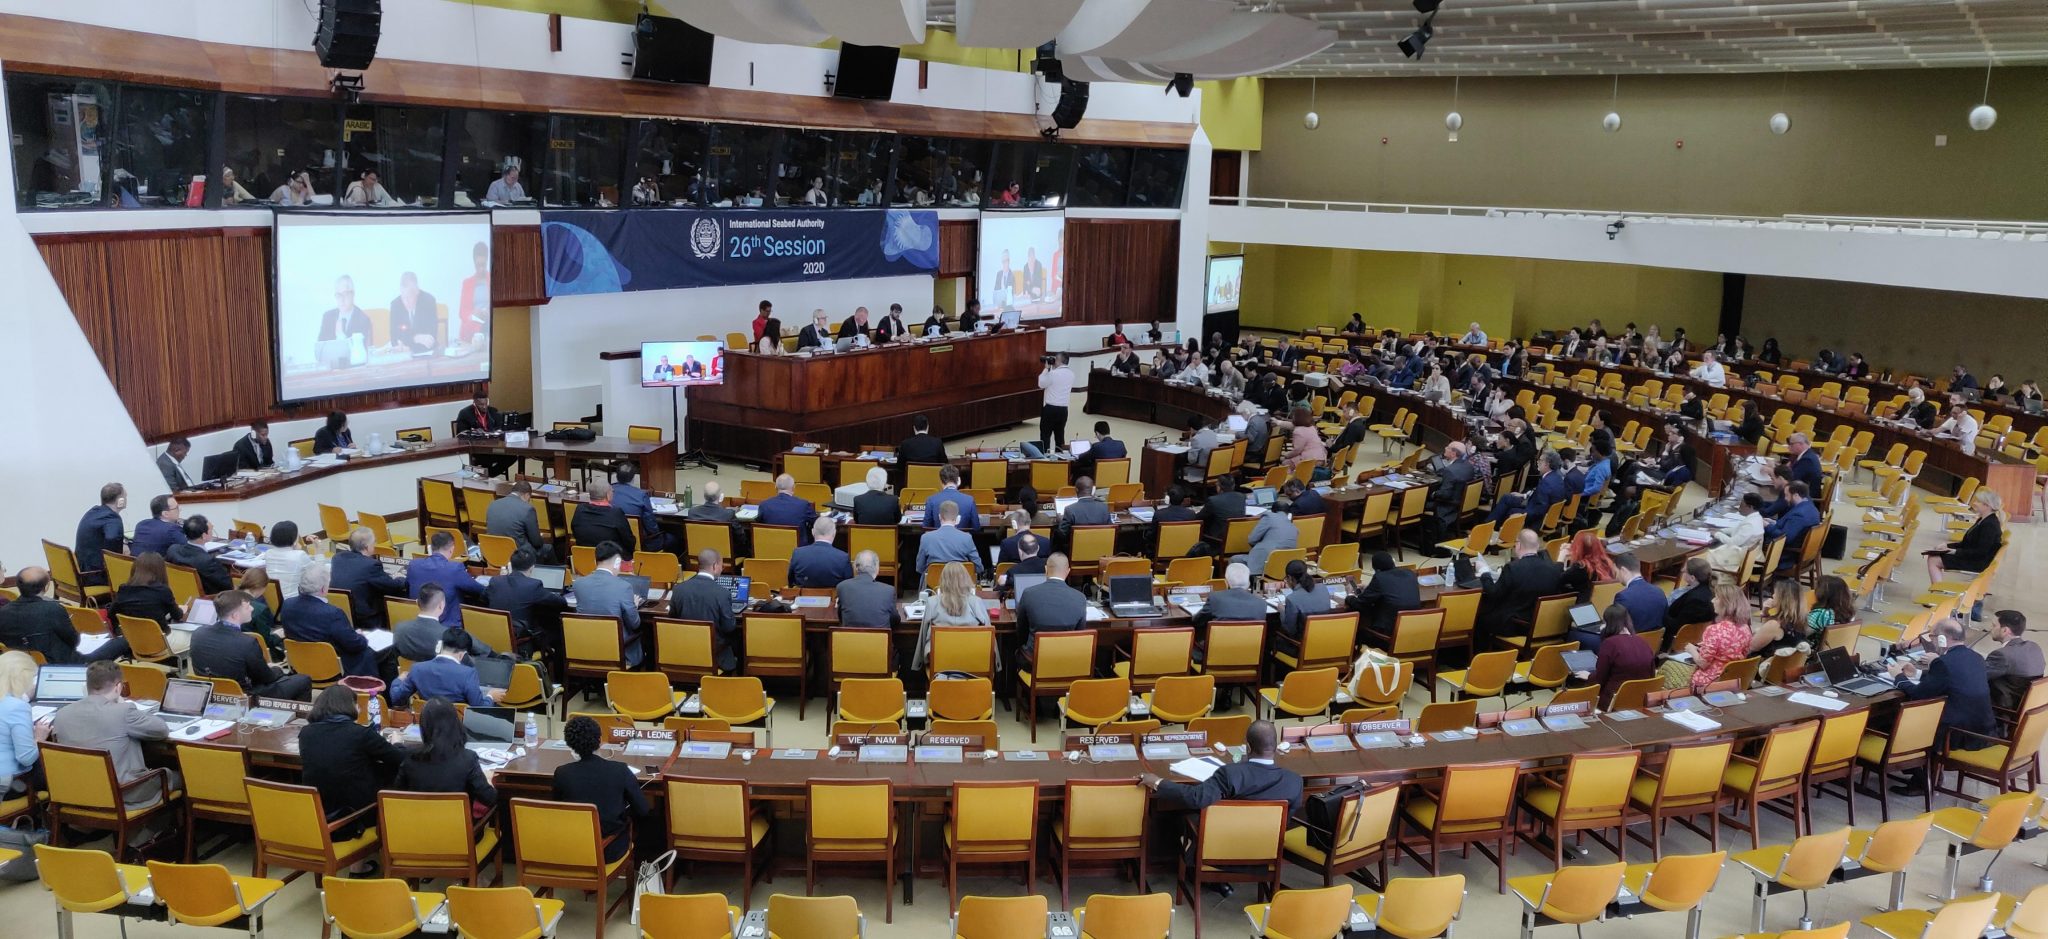
[The following is a transcript from a talk I gave at a side event during Part II of the 25th Session of the International Seabed Authority in July, 2019. It has been lightly edited for clarity.]

I want to change gears this afternoon and talk about a very different kind of mining. For the last two years, Diva and I have been engaged in a data mining project to discover what we can learn and what we still need to learn about biodiversity at hydrothermal vents from the 40-year history of ocean exploration in the deep sea.

We spend a lot of time discussing how biodiversity assessments feed into monitoring and management regimes as well as provide the baselines for environmental impact assessments and for establishing various kinds of protected areas.
But we rarely acknowledge that biodiversity is a wicked problem. By wicked problem, I mean a problem that is difficult or impossible to solve because of incomplete, contradictory, and changing requirements that are often difficult to recognize. A wicked problem is a problem that cannot be truly solved because there is no single solution.
If you asked 10 ecologists in this room to give you a set of criteria to assess biodiversity, you might get 15 different answers, which, for contractors and managers is certainly frustrating, but what I reckon is even more frustrating is that all 15 answers will be right and they’ll be right in different and sometimes contradictory ways depending on data availability, financial resources, spoken and unspoken biases, niche specialization, and a thousand other caveats.
Which is not to say that measuring biodiversity is the wrong approach, but that it is a challenging approach, especially when working across the vast distances of the deep seafloor.

So here’s the world I want to talk about. These are all the hydrothermal vent fields that are geologically active and biologically confirmed – by which I mean someone has sent a submersible, tow-cam, or ROV down and observed a chemosynthetic community. Depending on who you talk to, these vents can be split into 8 to 11 regions – called biogeographic provinces – that have very different community compositions. We tend to lump the communities that form around seafloor massive sulphides into one big group, but the reality is that these ecosystems are very different from one another.
Just as “forest” can describe ecosystems ranging from boreal forests to temperate needleleaf forest to tropical rain forest, “hydrothermal vent” describes a suite of deep-ocean ecosystems united by a shared dependence on chemosynthetically derived primary production but diverse in their composition and connection to one another.
So with that idea in mind, I want to take you back to a research cruise in 2013, where the seed for this project was planted in a conversation among me, Diva, and Adrian Glover, that can be boiled down to one seemingly benign question:

What is the most biodiverse hydrothermal vent biogeographic province?

Let’s go on a very short tour of a few of my favorite hydrothermal vents. Here we have Von Damme on the Mid-Cayman Spreading Center. This is a vent ecosystem absolutely dominated by a single species of vent-endemic shrimp that occurs in massive plumes around the vent effluent.

If we hop over Central America and head just a little bit further west, we arrive at the Galapagos Rift, where the dominant fauna of these vents are the iconic deep-sea tube worms, one of the largest and fastest growing invertebrates in the ocean. And because these tube worms are not just building biomass, but also building habitat, they support an entire community that thrives on the structures created by the tubes worms’ worm tubes.

And if we continue onward to the western Pacific, the vents found on these back-arc basin spreading centers host massive aggregations of two genera of snails which blanket the areas immediately adjacent to vent outflows. Like the tube worm they create habitat for a larger community of vent endemic organisms found across the western Pacific.
These are necessarily simplified generalizations of vent communities but there’s a reason I picked these three systems. They represent three very different ways of being a hydrothermal vent community.

Now you might think, ok, great, clearly the Western Pacific is more biodiverse than the Mid-Cayman, what’s so hard about assessing relative biodiversity? Why is this question so wicked?
When we talk about biodiversity, we’re really talking about sampling effort – how often we’ve visited a vent ecosystem and how many species we’ve identified from them – you’ve probably heard an ecologist here say that we can find new species in every sample if we’re looking for them. Some vent systems are incredibly well studied while some have only been visited a handful of times. Can you really say a vent that only three research teams have ever seen is more or less biodiverse than one that has been extensively studied for 40 years?
We have statistical tools to help get to the heart of this question, but those tools require discrete, random, even sampling and good identifications within discrete sampling units. At best we can look for good proxies that could qualify as a discrete sample, allowing us to form a rough estimate of global biodiversity, a baseline of baselines, from 40 years of haphazard sampling.

As you can probably guess from the title of this talk, we decided to treat research cruises as discrete sampling units. This has several advantages: research cruises occur over discrete points in time, initial sorting and identification of macrofauna occurs at sea, there is a strong culture of open, available cruise reports which detail what was observed and sampled and where, and they provide a 40-year archive of science and exploration in the deep sea, something you really can’t access anywhere else. Though they do have as many disadvantages as advantages that we had to account for in our analyses.
To capture an approximation of relative biodiversity among deep-sea hydrothermal vent biogeographic provinces we extracted family-level taxonomic data from sample and observation logs provided within formal cruise report. We then applied a standard tool to extrapolate incidence data and estimate family richness within each biogeographic province.

From the summary assessment of the data, we detected a strong signal of a North-South divide. We know of a little more the 650 active hydrothermal vent fields around the world, of which, about half have been directly observed. A slight majority of all known vents are found in the southern hemisphere, while a disproportionate majority of confirmed vents are found in the northern hemisphere. Unsurprisingly, the vast majority of biological research cruises have been conducted in the northern hemisphere.
Observed active vent fields that fall within some form of marine protected area (and please note for all of this we looked at both vent fields in the Area as well as within EEZs) all occur in the Northern Hemisphere, while the overwhelming majority of vents that fall within mining lease blocks (either exploration or exploitation) are found in the Southern Hemisphere.

We did a bunch of other analyses with this project, but let’s try to answer that one simply question. To orient you to what a family accumulation curve looks like, we’ve got number of samples – in this case cruise reports – on the x-axis and cumulative number of families observed on the y-axis. The solid lines are actual observations, while the dashed lines are extrapolated rarefaction estimates based on those observations. What you want to see in a graph like this are asymptotes. You want the curve to begin levelling off and the wide confidence intervals to tighten. We don’t have that for most provinces, but we do begin to see it for a few, particularly the Mid-Cayman Spreading Center, which levels out at well below 20 families. The Indian and Southern Ocean, in contrast continue to climb, suggesting, unsurprisingly, that there is much in these regions still waiting to be discovered.
Just a note, these aren’t grouped for any political or geographic reason, but by which fit together to make a clear and readable figure.

Likewise, we start seeming similar trends with the Mid-Atlantic Ridge, and the Southwest and Northwest Pacific, though note that the scales have changed, we have far more cruise reports and family richness is much higher in these regions.

And when we swing back around to the East Pacific, we see that the Northern East Pacific Rise has much higher biodiversity that the Juan de Fuca Ridge, but both are still lower than the Western Pacific.

So that was a lot, coming at you fast. This is a much more concise way of looking at the same data, in this case extrapolated out to asymptote and ranked by descending estimated family richness. And in this case, the Western Pacific and Southern Oceans come out on top, with the mid-ocean ridges tightly clustered in the middle, and the Mid-Cayman Spreading Center at the bottom.

Ok, so what does this all mean? It shows that the best-studied regions are not necessarily the most biodiverse, which is good in that is helps validate this approach and shows that the observed differences in biodiversity between provinces is real and not an artifact of sampling bias. Geologically speaking, back-arc basin spreading centers tend to have higher biodiversity than mid-ocean ridges.
And, though it seems like we’ve made a ton of progress exploring deep-sea hydrothermal vents in the last several decades, we’ve barely scratched the surface. Estimates from several provinces suggest that there is a reservoir of biodiversity just waiting to be discovered. For example, there has historically been less research focused on the Indian Ocean, and even at this meeting some delegates have mentioned that Indian Ocean vents have relatively low biodiversity, this study suggests that hydrothermal vents in the Indian Ocean are the equals of other mid-ocean ridges and could play as significant a role in biological discovery in the deep sea in this century as the Mid-Atlantic Ridge played in the last.
And finally, in the deep-sea mining context, one overwhelming trend is clear. We study the North. We protect the North. But we’re planning to mine the South. I’ll leave it up to you to decide what that means for our ocean future.

This project was funded by the Pew Charitable Trusts and there are far too many people to thank, many of whom are in this room. We have a paper coming out imminently, but if you just can’t wait to read the full study, we have a preprint available on PeerJ now which differs a bit in the depths of analyses but not much in the conclusions from the final peer-reviewed version.
Thank you.
Read the full, open access paper “262 Voyages Beneath the Sea: A global assessment of macro- and megafaunal biodiversity and research effort at deep-sea hydrothermal vents” at PeerJ!


