 This post is part of the Crowdsourcing ConGen project. Crowdsourcing is the process of opening up a resource to a community for input and contributions. Throughout the coming year I’ll be posting manageable pieces of this document for the audience of Southern Fried Science to read and review. Please visit the main post for an overview.
“I have never done anything useful. No discovery of mine has made, or is likely to make, directly or indirectly, for good or ill, the least difference to the amenity of the world.” ~ Godfrey Harold Hardy
The simplest model for a population is one in which the frequencies of alleles and genotypes remains constant from generation to generation. Under this model, there are no outside forces influencing selection, there is no tendency for any allele or genotype to be favored over any other, diploid alleles will recombine randomly in accordance with Mendelian inheritance. A population that behaves this way is said to be in Hardy-Weinberg Equilibrium. This almost never happens.
In order for a population to be in Hardy-Weinberg Equilibrium, several assumptions about that population must be true:
- Individuals within the population must be mating randomly with respect to the specified loci.
- No mutation can be occurring at the specified loci.
- There is no selective pressure with respect to the specified loci
- No migration into or emigration out of the population can be occurring.
- The population is functionally infinite.
Notice that assumptions one through three are with respect to the loci being examined. Population genetics doesn’t look at entire genomes, only a very small subset of particular loci, often chosen because they meet these criteria. These phenomena can be occurring within the population, but as long as the specified loci are independent of these effects, Hardy-Weinberg Equilibrium can still be achieved. The forth assumption is incredibly rare, and if you truly have a population with 100% isolation and absolutely no gene flow, your work as a population geneticist is done. The final assumption is, of course, impossible.
Assuming a population under Hardy-Weinberg Equilibrium, a diploid locus with two possible alleles will have the genotypes AA, Aa, and aa. If p is the frequency of allele A and q is the frequency of allele a, then the product of the frequency of the three possible genotypes can be written as:
So from this equation we can approximate a population in Hardy-Weinberg Equilibrium. More importantly, we can test whether a set of alleles at a locus is in Hard-Weinberg Equilibrium, and detecting Hardy-Weinberg Equilibrium and deviations from Hardy-Weinberg Equilibrium is the first step in defining populations.
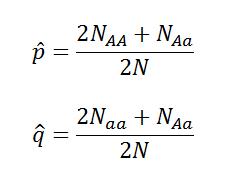
Real samples will never behave like the model, but we can ask the question “How close to Hard-Weinberg Equilibrium are these samples?” We can calculate the expected allele frequencies of a population in equilibrium with the following equations derived from the equation above:
 For these equations, p(hat) is the expected frequency of allele p, q(hat) is the expected frequency of allele q, NAA is the number of individuals sampled with genotype AA, Naa is the number of individuals sampled with genotype, NAa is the number of individuals sampled with genotype Aa, and N is the total number of individuals*.
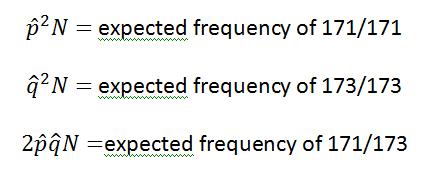
So let’s examine a microsatellite locus with two alleles, 171 and 173. Assume a total of 23 individuals. Five individuals have genotype 171/171. Twelve have genotype 171/173. Six have genotype 173/173. From this sample set, we can calculate and and compare them to our know observed frequencies. To calculate the expected occurrence of each genotype, you can use the equations:
 So we find that equals 0.478 and equals 0.522 while the expected occurrence for each genotype is: 171/171 equals 5.3, 171/173 equals 11.5, and 173/173 equals 6.3.
A quick summary:
Genotype 171/171
- Observed Frequency – 5
- Expected Frequency – 5.3
Genotype 171/173
- Observed Frequency – 12
- Expected Frequency – 11.5
Genotype 173/173
- Observed Frequency – 6
- Expected Frequency – 6.3
Clearly these are not in perfect equilibrium, but have the observed values deviated significantly from Hardy-Weinberg Equilibrium? The simplest way to test this is to use a chi-squared test. In order to perform a chi-squared test, you must calculate the X2 value for the sum of all genotypes and determine the degrees of freedom. With those two values, you can compare them on a table of chi-squared values to determine if there is significant deviation from Hardy-Weinberg Equilibrium.
To calculate the X2 value, use the equation:
 For this example the X2 value equals 0.05.
To determine the degrees of freedom, simply subtract the number of alleles from the number of possible genotypes. With two alleles and three genotypes, we have 1 degree of freedom. Take a look at this chi-squared table and determine where our X2 value falls. By convention, we define significant deviation as any value that has a probability of less than 0.05 on the chi-squared table. This can be interpreted as the probability that the observed values would deviate from the expected values merely by chance is less than 5%. For our observed values to deviate significantly from Hardy-Weinberg Equilibrium, the X2 value would have to be greater than 3.84, so this example falls well within the limits for Hardy-Weinberg Equilibrium.
This means that we can make a few inferences about this locus and this population. This locus is not being selected for either in general or via sexual selection. This locus is also not mutating. Within the sampled population, there is little to no migration or emigration and this population is likely very large. Some of these inferences may be wrong. This could be a population that has undergone a recent bottleneck event, so the genetic diversity may not reveal a new, smaller population size. Sampling may have missed rarer alleles or simply been too small to fully capture the total diversity of the population. But in general, we can assume that this marker is reasonably good for estimating parameters of population genetics.
Here is another example to try: 4 individual with genotype AA, 65 individuals with genotype Aa, 8 individuals with genotype aa. Does this sampled population deviate from Hardy-Weinberg Equilibrium?
Discovering the reasons for deviation from hardy-Weinberg Equilibrium and defining how the allele frequencies change among populations that may or may not be in Equilibrium is the foundation for the rest of population and conservation genetics.
~Southern Fried Scientist
*This example was borrowed from the textbook “Conservation and the Genetics of Populations”
