 Earlier today, the Marine Conservation Institute and Mission Blue released SeaStates, the first ever national ranking of how well different U.S. states and territories protect their ocean resources. The full report is available online and is an important read, but can be summarized in 5 words: “Most states aren’t doing enough”.
The gold standard for the protection of marine resources is no-take marine reserves, areas of the ocean where no fishing or oil/gas extraction is permitted. Decades of research on marine reserves worldwide have shown that they usually have more fish, bigger fish, and more species of fish than environmentally similar areas (often adjacent to the reserve border) where fishing is allowed. In other words, when you don’t kill fish, more of them are alive.
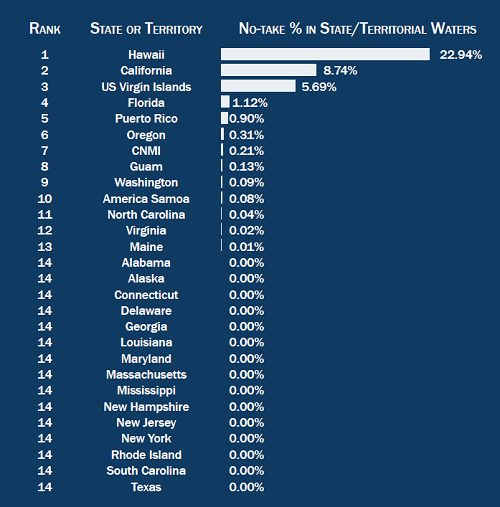
While recommendations of how much of the ocean needs to be protected by no-take reserves vary, a commonly cited figure is 20%. Of 23 U.S. coastal states and territories, only one (Hawaii) achieved that goal. My current state of residence, Florida, has the fourth highest % of no-take marine reserve at 1.12%. North Carolina, home to many Southern Fried Science writers, is in the top half with 0.04% no-take marine reserve. 15 coastal states and territories don’t have a single square foot of no-take marine reserve. See how your state stacks up:

“Whether you love our oceans for their beauty, for their fishes and marine mammals, or for generating half of the oxygen we breathe, you should want them to be strongly protected. But most states in this report get a score of zero and only a handful are protecting even 1%. That’s not good enough when our oceans are facing grave threats like overfishing and pollution,” said Dr. Sylvia Earle of Mission Blue in the press release accompanying this report.
Overall, just 1.2% of U.S. coastal state and territory waters are protected by no-take marine reserves, the overwhelming majority of which is in Hawaii. Worldwide, just 1.1% of the ocean is no-take marine reserve (1.8% is no-take marine reserve or “multiple use” marine protected area). For reference, approximately 13% of land is protected. If you want to explore the world’s marine protected areas in detail, check out MPA Atlas, a project of the Marine Conservation Institute, which was used to generate the SeaStates report.
If you’re as horrified by these results as I am, the report recommends several ways that you can help:
• Urging our leaders to create more no-take marine reserves
• Making conserving the oceans an important issue, and voting for people who really
share our values and act on them (see oceanchampions.org)• Visiting coastal locations only in states that do the best job of protecting our marine
environment• Eating only sustainably caught seafood (see montereybayaquarium.org) at home and at
restaurants, and telling that to those who sell you seafood• Finding meaningful ways to reduce your family’s energy use
• Supporting nonprofit, tax-exempt organizations who work to save marine life

I wonder if this study assumes that state/territorial waters go out to three miles? In Texas and the Gulf Coast of Florida it is 9 miles. In CNMI it is zero.
“Using publicly available data our scientists determined the areas in estuaries and coastal
waters within each US state and territory as defined by the Submerged Lands Act. This area
extends 3 nautical miles from each state’s coastal baseline, except for Texas, Florida’s west
coast and Puerto Rico, which have jurisdiction over waters within about 9 nmi from shore.”
Saipan Blogger,
We did take the extended state waters of the Florida gulf coast and Texas into account. Thanks! Please check out our report, we fill in all the methodology there. We did our best to be thorough.
Thanks, Saipan Blogger,
It looks like I did miss the lack of submerged lands jurisdiction by CNMI over it’s marine waters. I followed your tip and read up on the series of court cases and bills brought before the US Congress over the last decade calling for the granting of 3nm of a territorial sea to CNMI…and the lack of success so far, too. The basic issue is that CNMI was brought into the fold after the Submerged Lands Act that granted territorial seas to territories in the same manner as US states and subsequent bills rectifying CNMI’s situation haven’t made it all the way to become law.
We will issue an erratta and revised version of the SeaStates report reflecting those facts. As Beth already mentioned, I’m almost 100% certain that we have captured the correct territorial sea/submerged lands area for the remaining states and territories. As mentioned, Texas, Florida’s gulf coast, and Puerto Rico all have 9nm (3 marine league) territorial sea areas as a hold over from common maritime law during Spanish rule.
Thanks for the tip,
Russ
I found this report remarkably simplistic and troublesome. Here’s why: no-take reserves are only a partial solution–the emphasis on spatial restrictions on fishing diverts efforts to deal with pollution, habitat loss outside of reserves, ocean acidification, hypoxia, HABs and traditional fishery management. You can’t manage marine resources by focusing only on no-take reserves unless your goal is simply to end fishing altogether.
I’m sure the authors of the report would agree that these other issues are also important, and I do have some sympathy for the argument that trying to present a more complex and nuanced assessment of how we manage marine resources is a daunting task and likely to alienate some folks otherwise likely to be interested. However, to my mind, this does us all a disservice: 20% (50+%!) of our coastal waters closed to fishing will not ensure the health of state marine resources if we fail to manage the remainder responsibly. Part of that responsible management must include acknowledging that we have an impact on the marine environment including extractive uses unless we all forego seafood (well, and stop driving big ships around or placing undersea cables or…you get the picture).
Two quick examples for why this report is a problem: Alaska, according to the report, has no no-take reserves, yet has some of the best-managed fisheries in the world, and, I’d bet has some of the most pristine nearshore ecosystems in the US. Hawaii has a whopping 22.94% of its waters completely closed to fishing, but a huge proportion of those closed areas are in the NW Hawaiian islands where access is difficult at best while many of the reefs found along the main islands are severely over-fished and heavily impacted by activities on land (e.g., nutrient run-off).
There’s no question that marine reserves are an important tool in management and conservation, but they are not a magic bullet.
Dear Peter,
Thanks so much for your interest. We believe that a thorough read of the report would clarify your concerns and our reasoning for choosing no-take areas. In recognition of the exact points you mention.
Spoiler Alert: We agree with you about Hawaii!
All the best,
Beth
Russel Moffitt (if you’re still checking),
I was wondering where the 13% terrestrial preserve reference number came from. I dug through the report and the website but couldn’t find a source. I thought that number sounded a bit high when comparing ‘preserved’ lands to no-take marine reserves.
Of course, I live in the northeast so my sense of scale is likely a bit skewed.
Thanks for the replies David, Beth, and Russell! I hope my comment didn’t come off sounding like a criticism. I was just wondering how the values would change if you used 3 miles vs 9 miles, if at all.
Hi Teller of Tales,
Thank you so much for your interest.
According to the 2012 UN Report on the Millennium Development Goals (MDG), the most recent estimates from 2010 (in 2011 MDG analysis) indicate that 12.7% of global terrestrial area is “protected.” I believe the number came from there. Hope this helps!
Beth
References:
http://www.wdpa.org/Statistics.aspx (5th bulleted link down the page downloads xls data)
http://unstats.un.org/unsd/mdg/Metadata.aspx?IndicatorId=0&SeriesId=783 (explains how percentage was calculated in detail)
I believe you are referring to the comparison of about 13% terrestrial area in protected areas vs about 1.8% of the ocean. I gleaned the 13% estimate from consensus among a number of sources. Start with the the Wikipedia article on Protected Area at http://en.wikipedia.org/wiki/Protected_area then look through the sources of that statistic. Namely the World Database on Protected Areas (www.protectedplanet.net), reports from the Convention on Biological Diversity, UN Report on the Millennium Development Goals (MDG 2011 http://www.wdpa.org/Statistics.aspx and http://unstats.un.org/unsd/mdg/Metadata.aspx?IndicatorId=0&SeriesId=783), and a number of scholarly articles (Jenkins and Joppa 2009, Soutullo 2010, etc.).
Going back to the land vs. sea comparison, the 13% and 1.8% represent the total area under any form of “protected area” designation. Jenkins and Joppa note that in 2009 only 5.8% of land area has strict protection for biodiversity. Compare that to the about 1% of the world’s ocean in no take area. Yet even that figure is skewed, because almost all of that is contained within the 10 or so largest MPAs on the planet under no-take. Almost all of those are far from human population centers and activity.
Whether we’re talking about land, or freshwater systems, or the ocean, the distribution of conservation management regimes really does matter. Ideally, a piece of all major biogeographic regions and the habitats and ecosystems contained within can be protected forever. The rest is up to us to manage our many human uses and interests as best as possible. No-take areas are just the insurance policy in case we don’t always get it right everywhere else all of the time (hint: we won’t always get it right).
Regards,
Russell Moffitt
Marine Conservation Institute
MCI folks:
Thanks for the links. Quite an impressive, and extensive, dataset they have compiled (protectedplanet.net has a handy map server if anyone wants to see what areas are included). Like you point out, my concern is comparing the 13% terrestrial to 1.8% no-take marine is that its an apples to oranges comparison. Many (most?) of the terrestrial areas calculated include some form of consumptive use. When using the same criteria of “protection” to generate the 13% terrestrial figure, the marine areas of the US comes out to 28% for 2010; a significantly higher percentage than terrestrial (data from the 5th bullet link mentioned above).
It also seems isolating state waters is inherently restricting the data to the most heavily used marine areas, akin to quantifying conservation areas in cities and urban areas, and using that as a basis of an argument that more needs to be done. Which isn’t to say that might not be a valid viewpoint, if a city (or estuarine system) is a unique or vital habitat component or a migration route or something. Which is certainly true in many marine instances.
As your report states, there is very sound science proving the benefit of no-take and other MPAs, and certainly they are a valuable tool in a conservation portfolio, although certainly not the only one. And I understand the difficulty in distilling the complicated conservation picture down to a report for a general audience. In the age of facebook activism, I’ve developed a habit of checking sources and numbers.
Saipan Blogger,
Not at all! We really appreciated your comments and would love to speak to you more about your expertise in the CNMI area!
Thanks again!